Disclaimer:
The CSS for this page is not rendered optimally on Safari. For the best reading experience, I recommend using Google Chrome.
Videos:
For those who don't want to read the long-winded write-up, below is a video of an example runthrough. Improvements to be made, but I'm pleased with the progress so far.
Video 1: An Example Runthrough
Below is a quick run-through of most the React and Flask code. I would make the repository public, but there is paid/third-party data inside of it, so it'll remain private (for now).
Video 2: Project Code
Write-Up:
Hello, my name is Asad. Today, I'm presenting something I worked on during the 2nd semester of the 2022-23 school year, in my free-time. This is a football simulator game, centered around strategy and statistics. In this immersive experience, players are challenged with the task of assembling the ultimate team of footballers within a limited budgetary constraint (£850). Each footballer's quality is reflected in his price, with higher-rated players costing more. Once the teams have been meticulously crafted, players dive into a tournament featuring 128 teams. Among them, 127 teams are dynamically generated, each employing a unique formation and the best possible players from their assigned pool.
How did I get this idea? Well, it was based on a project I had created in the past (my 1st semester at uni). It was my first real coding project, and I loved every minute of it, because A) I love football, B) I like coding, and C) I really like statistics, game theory, decision trees, etc. However, the quality of the code was quite poor. For example, look below to see the impenetrable strategy I used to validate input (in these 2 instances, I was checking if it somewhat resembled 'Timo Werner' or 'Raul Jimenez'):
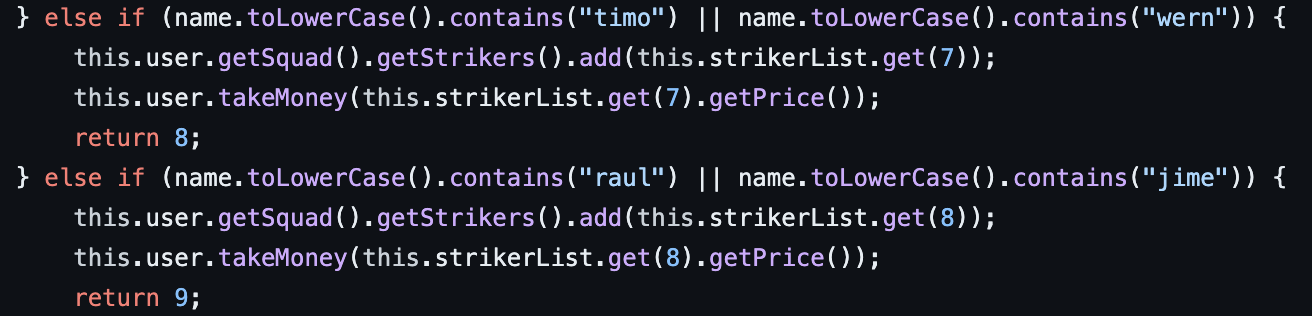
Figure 1: Manual Checking of Input
🙈 This is why algorithms are important. Had I known about tries/prefix trees/enums/etc., I would've avoided writing 1000+ lines of poor quality code like this (yes, I did that for every single player). Thankfully, having taken multiple classes on algorithms since, and having done my own independent study of algorithms, I now know the way. In fact, I actually utilised tries heavily in another project I worked on this semester, but I will save that chat for a later github.io page. Regardless, I appreciate the efforts and zeal of my past self, as without my inferior past work, I wouldn't have been able to complete this massively superior project.
In the words of esteemed artist Prodigy, let me start from the beginning, at the top of the list. First, I wanted to get match lineups from the past 5 years, from all of the top leagues (Bundesliga, Premier League, Serie A, Ligue 1, and La Liga). Secondly, I wanted to use deep learning to predict the outcome of matches. However, to do so, I needed to find a reliable metric that adequately measured a team's quality. In the typical match data that I found, there was nothing that fit the bill. Naive thinking initially led me to believe that scorelines and shots on target were enough to differentiate the best sides from the worst (not really, I just wanted to make mention of this), but that's not the case. For example, look at the result below:
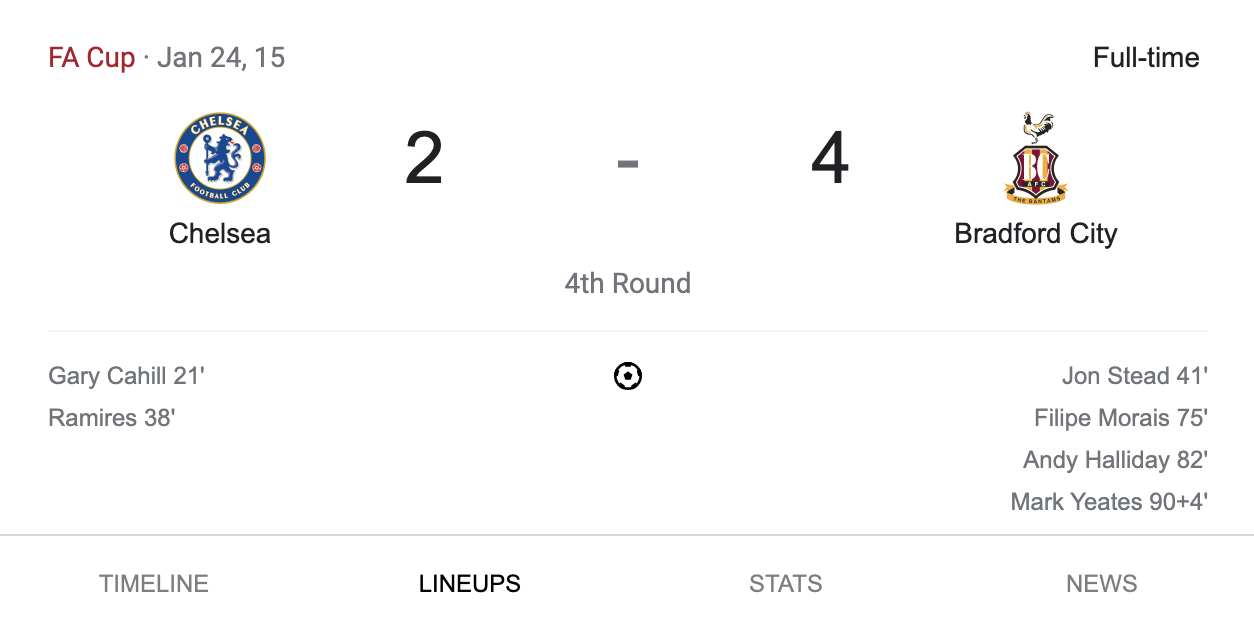
Figure 2: Chelsea Got Battered
For the uninitiated, at the time, Bradford City were in the 3rd division of English football and had finished the season in 7th place. They are now in the 4th division. Chelsea, on the other hand, were in the 1st division (Premier League) and actually won the league in dominant fashion that year. Additionally, Chelsea are (unfortunately) a big club that have won 2 European Cups and 5 1st division titles. Despite the fact that they've been poor pretty much the entirety of the current season (2022-2023), they are still a much, much bigger side than Bradford City (🥳 what an accomplishment!). Just look at the side they fielded:
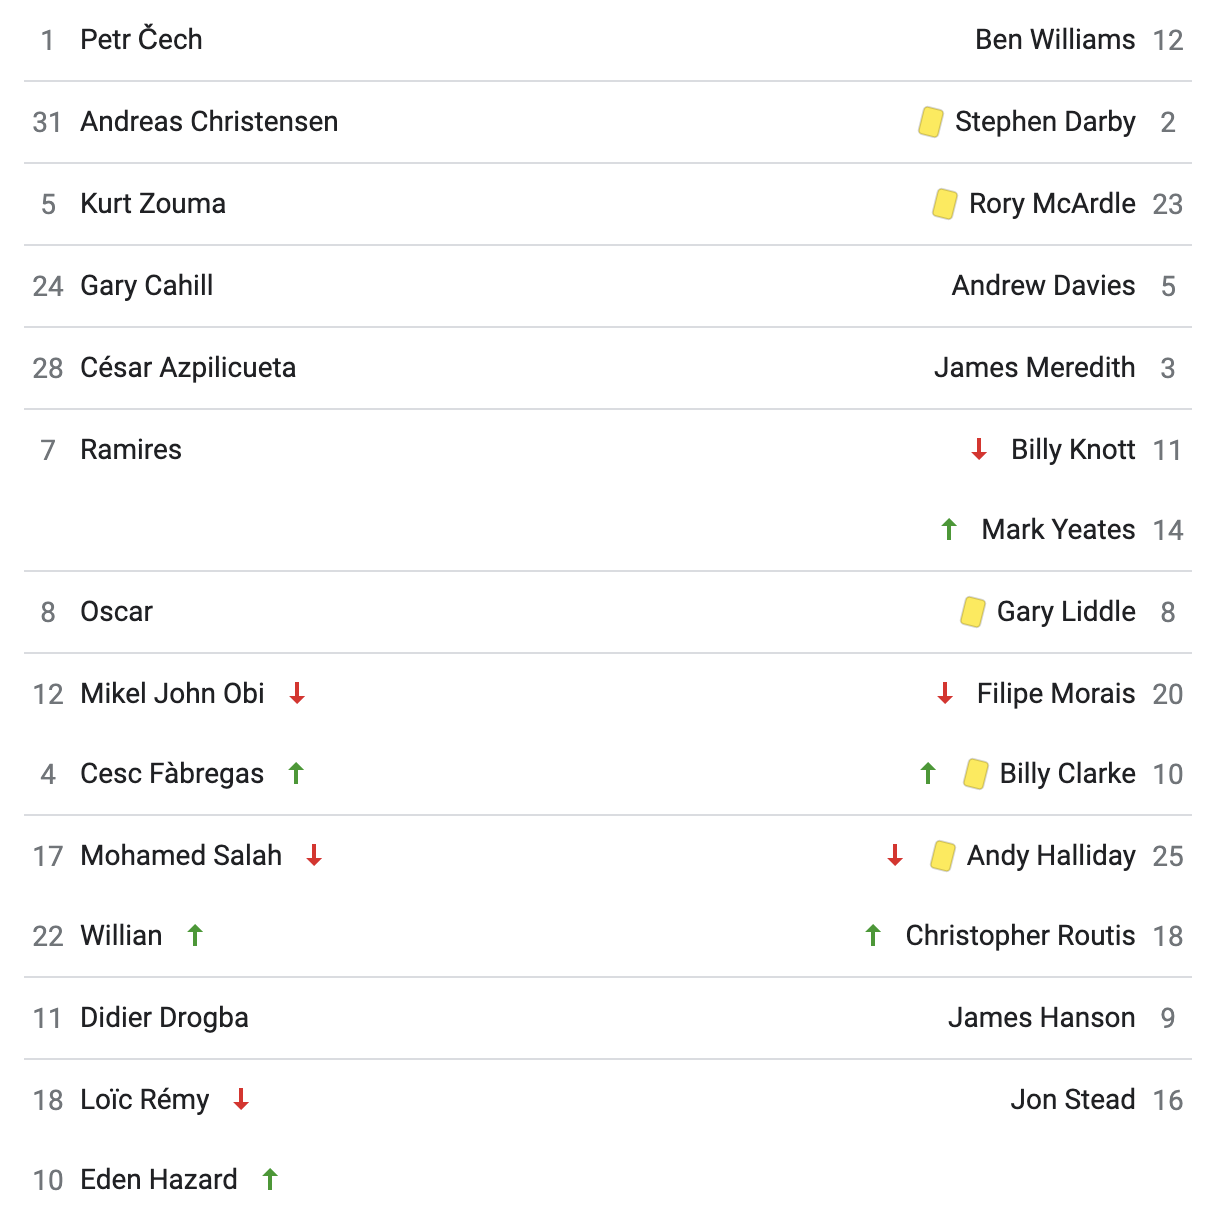
Figure 3: Chelsea - Bradford Line-Ups
They had 3 world-class players on the pitch (Hazard, Cesc, Azpilicueta), along with various other quality players (Ramires, Oscar, Remy, Willian, Cahill). Even the likes of Salah and Zouma, both of whom were fairly underwhelming for Chelsea (to be fair to Zouma, he suffered an ACL injury early on during his time there), have had fantastic careers after they've left the club. Salah has established himself as (arguably) Liverpool's best ever player, amongst the likes of Dalglish, Liddell, Rush, and Jay Spearing, whilst Zouma is currently West Ham's best defender. Point is, they had quality all over the park, and they had enough firepower to smash the jobbers of Bradford City (no offence) 4 or 5 nil.
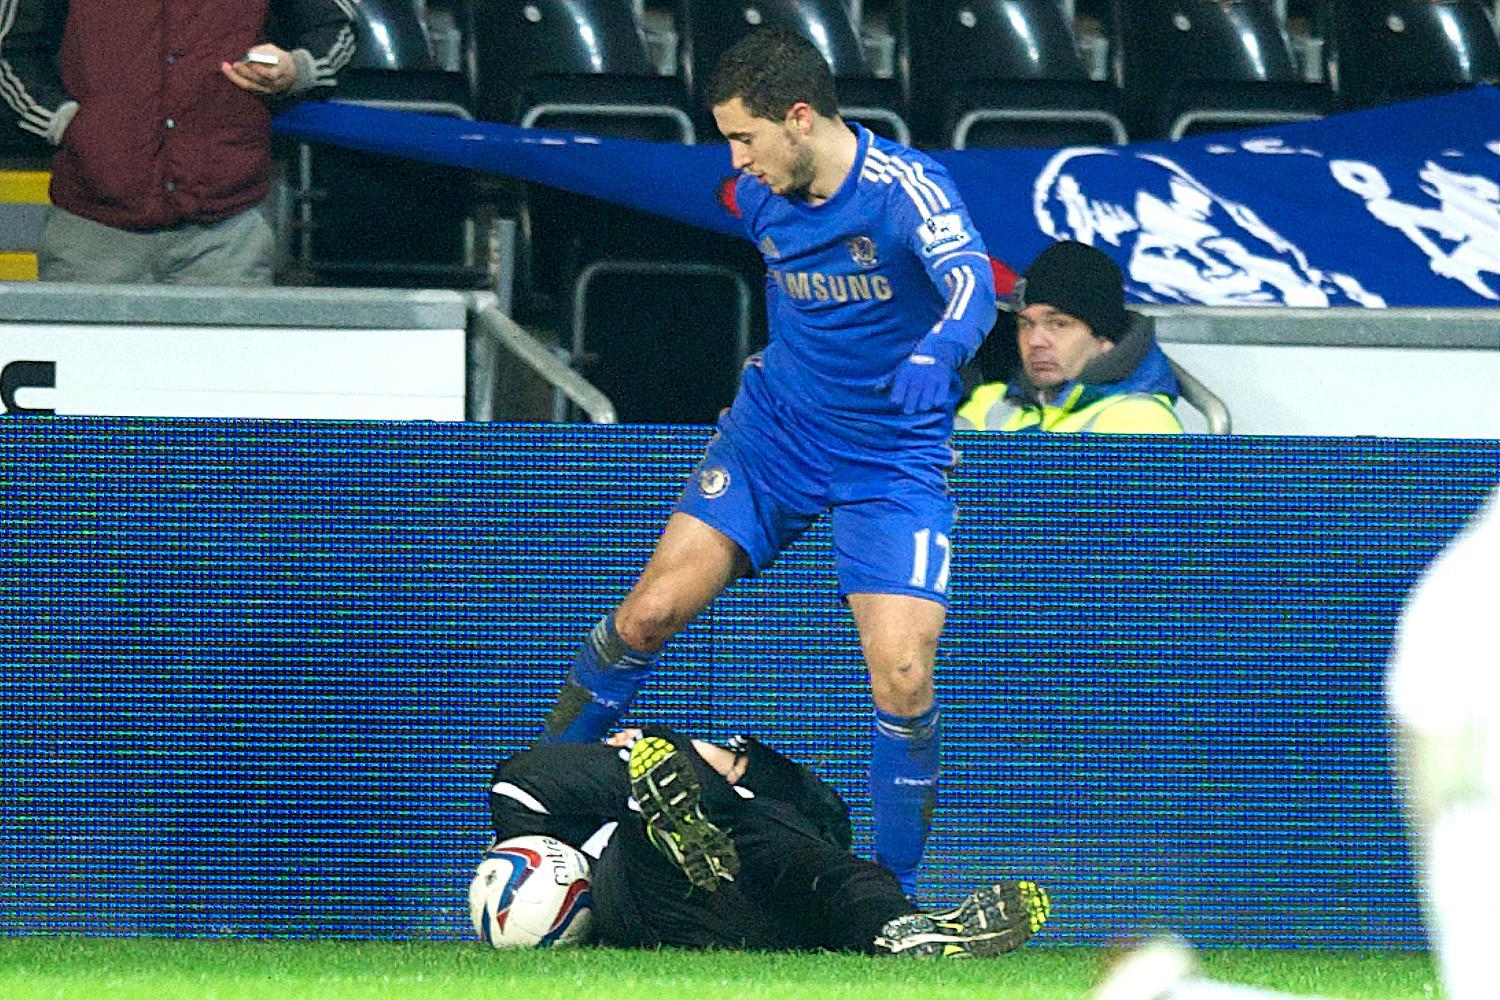
Figure 4: Eden Hazard
But, this is football. Shocks happen fairly often (usually not this level of shock though), so aggregating goals and shots is not the best strategy. So we cannot use goals scored, or shots on target, or possession, or any of these other (fairly) arbitrary statistics to measure a team's quality. I really thought measuring goals scored across seasons would be a decent measure of a team's quality, but it really does not work for the lesser leagues. For example, APOEL, a club in the Cypriot First Division, regularly demolish their domestic opposition, but they, in turn, get battered by foreign opposition in the Champions League. Therefore, I did something I was more comfortable with, and something that made sense. I decided to use the FIFA ratings of individual players and map them to historical match data to correlate shots, possession, fouls, and goals with the quality of a side/collection of players. I downloaded some CSV sets off of Kaggle for the past 9 FIFA games.
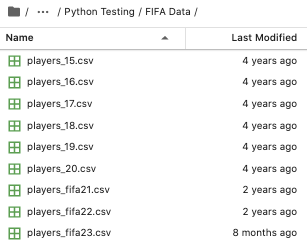
Figure 5: Files
For the lineup information, I used api-football.com. I used this API service to get fixture data from the 2015-2016 season onward, matching the FIFA data. From the fixtures, I collected the stats associated with each individual match (e.g. shots on target, fouls, goals, etc.), but I had to make separate calls to the fixture endpoint in order to collect the lineups associated with each match. I then mapped the player ratings from the FIFA CSVs to the lineups. Firstly, this was quite a challenge, because I imported 2 different sets of CSVs. The first set had players' full names (e.g. instead of Cristiano Ronaldo, it was Cristiano Ronaldo dos Santos Aveiro), whilst the second set had players' "colloquial" names (e.g. the reverse). So, I created a dictionary/JSON file mapping these two sets of names to one another to ensure a seamless mapping of ratings to line-ups. Additionally, different spellings of names and the inclusion/exclusion of accents proved to be obstacles, but I overcame them by hardcoding fixes.
Secondly, FIFA player ratings can vary widely through the years, especially across the span of 9 FIFA games. For example, below is Jerome Boateng:
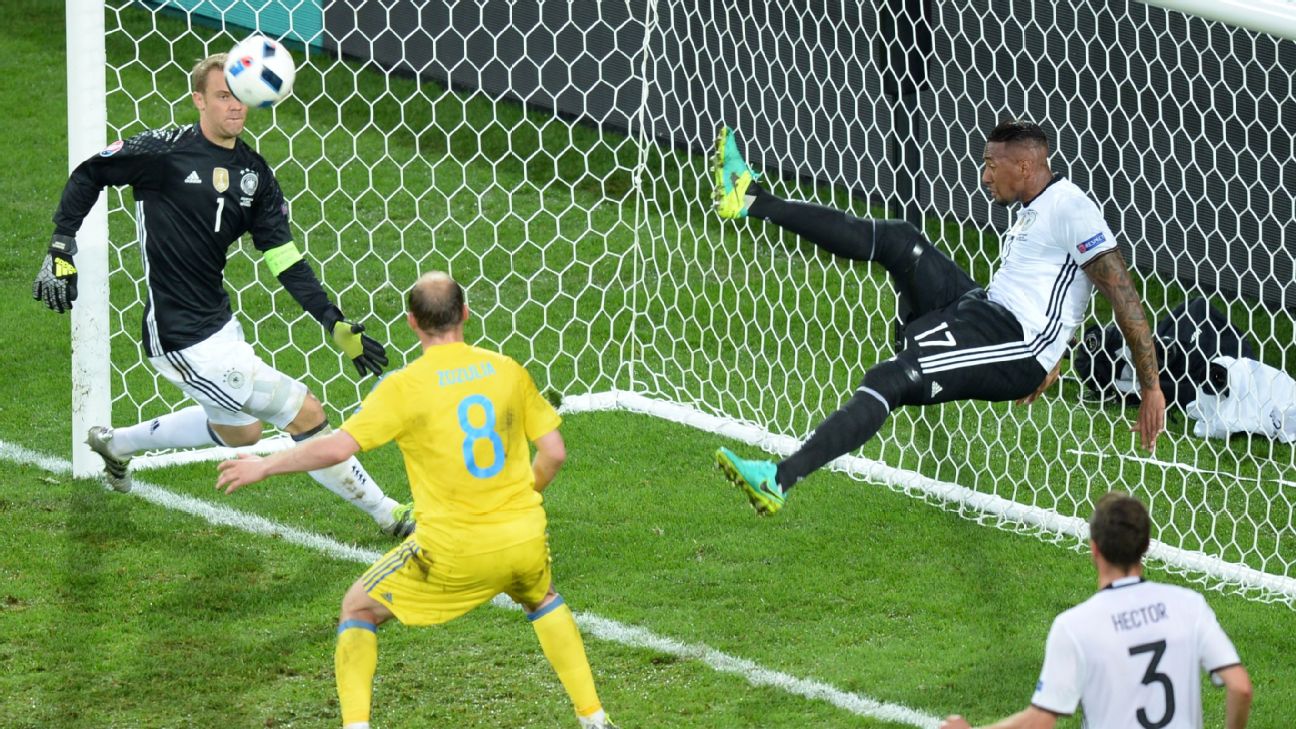
Figure 6: Jerome Boateng
On his day, he was a magnificent player. Legendary footballer. 2 time European Cup winner, World Cup winner, and I don't even know how many Bundesliga titles he's won. In FIFA 15, he was the highest-rated centre-half in the game, and rightfully so. In FIFA 16, he was the second highest-rated, just behind Thiago Silva, who was only 1 point above him. Then, in FIFA 17, he was the highest-rated centre-half in the game, with an incredibly rare rating of 90. Guy was incredible in his prime. Quick, strong, fantastic at playing out from the back, and a very, very good leader. The only stain on his footballing career is that he played for Manchester City (🤮).
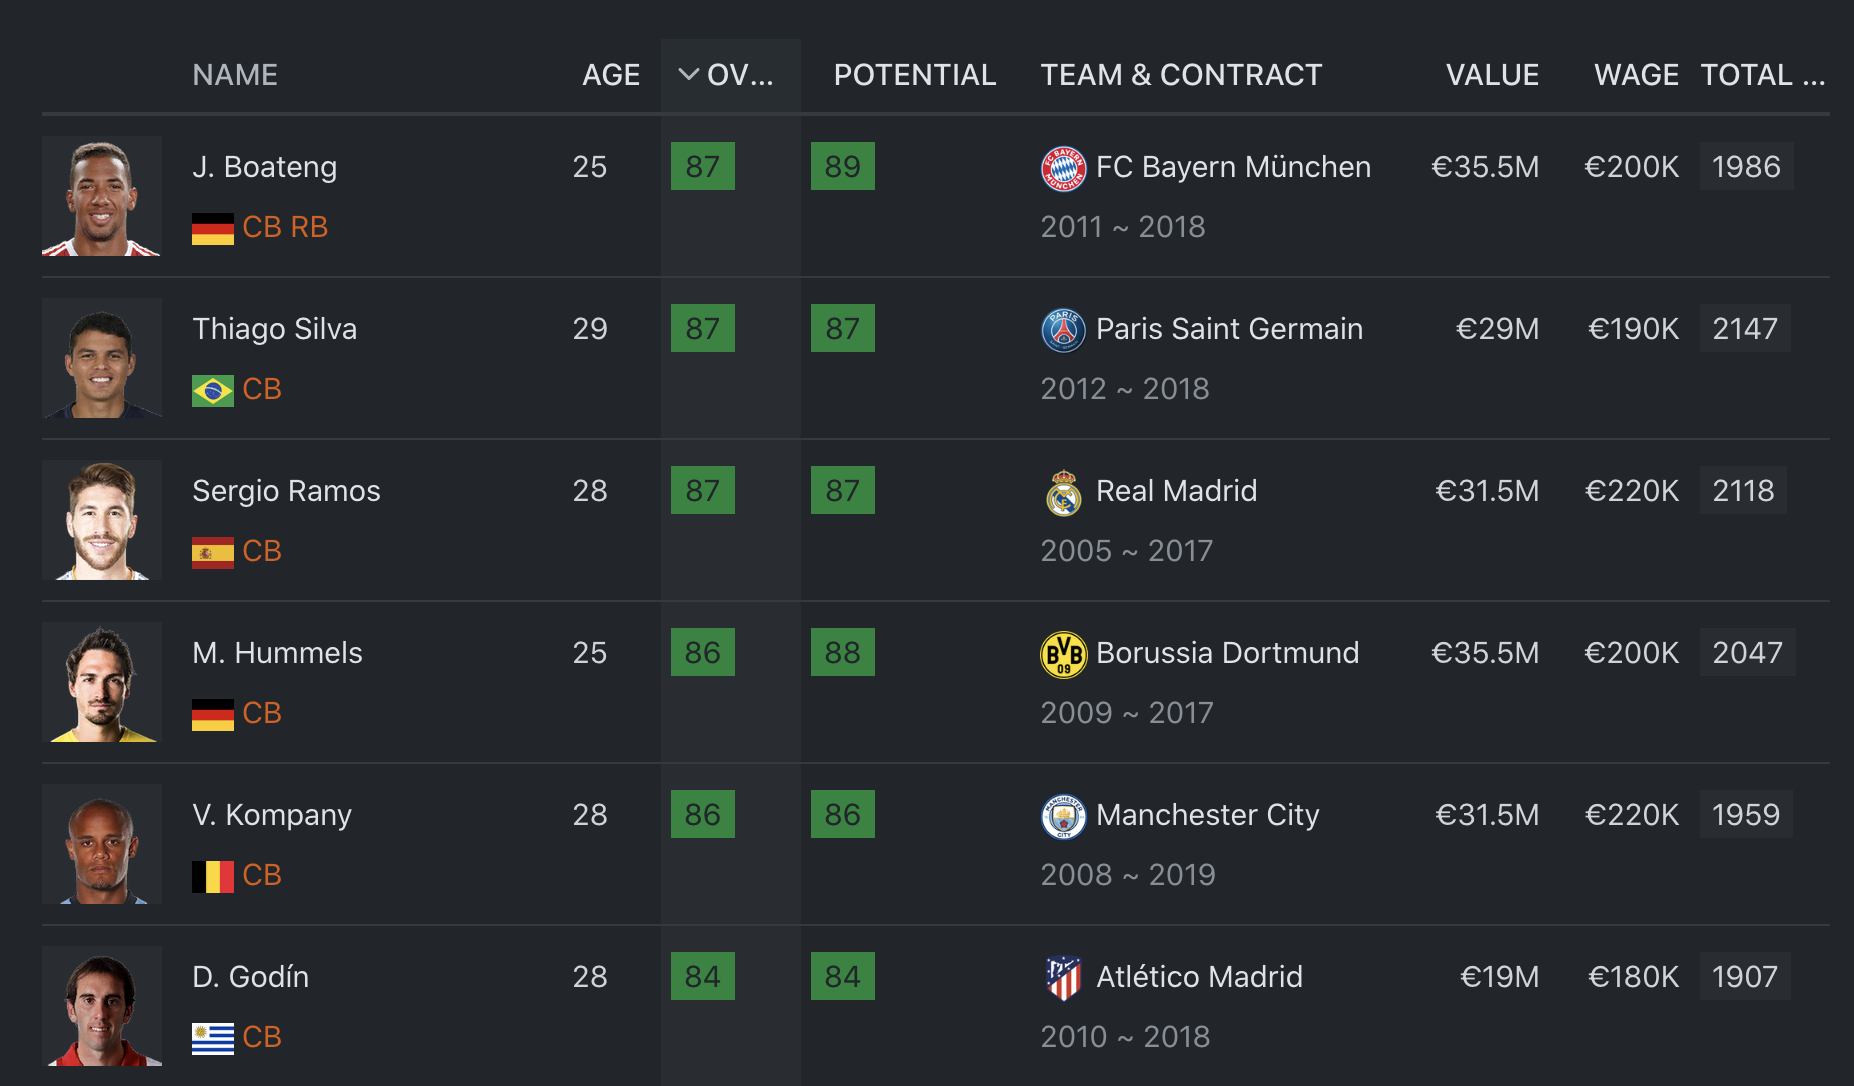
Figure 7: Boateng's FIFA 16 Rating
Unfortunately, nowadays, he's a bit poor. Having suffered serious injuries during his last few seasons at Bayern Munich, starting in the 2016-17 season, he began to lose his pace and athleticism. In the 2018-19 season, he eventually fell behind Mats Hummels and Nicklas Sule in the pecking order. He also had a disastrous 2018 World Cup. He was poor in the 2 matches he played, and he even got sent off in the must-win match against Sweden. Overall, Germany's World Cup performance was shocking, and it pretty much ended his national team career, as it also (temporarily) did the likes of Mats Hummels and Thomas Muller.
Video 3: Boateng's Poor World Cup
He had a bit of a renaissance year in the 2019-2020 season, as Bayern Munich won the treble, but since then, he's just not been the same player. He's constantly making errors in big matches, he's getting slower, and Lyon are looking to get rid of him. Not a good end to such an incredible career.
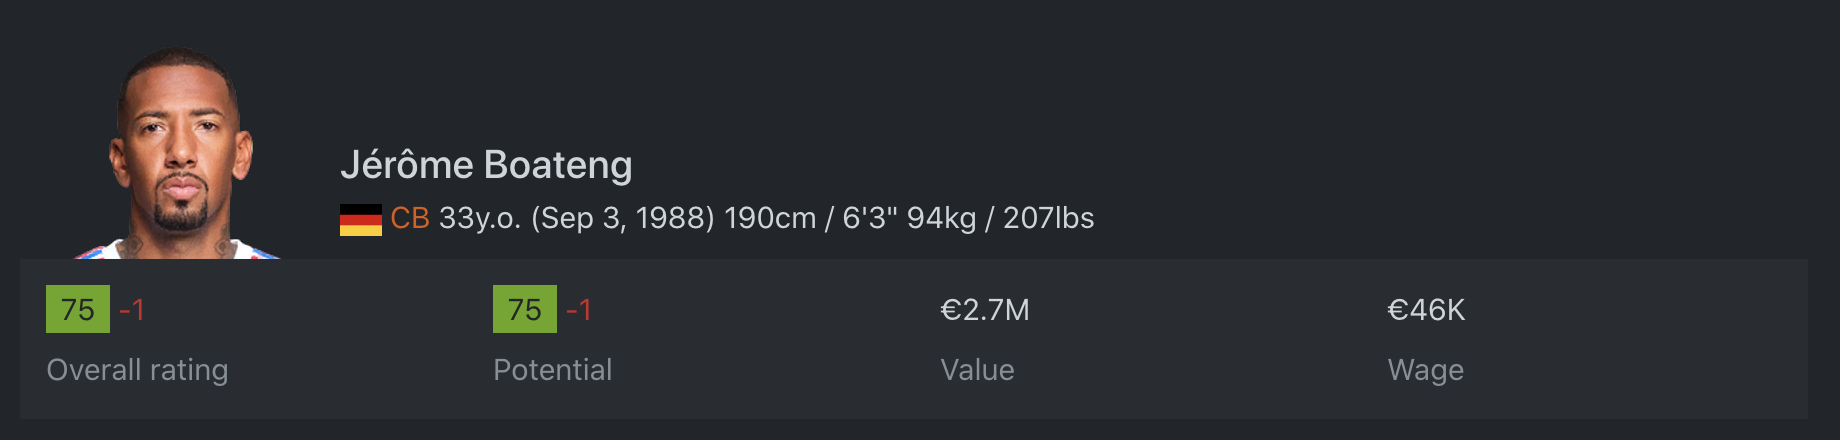
Figure 8: The Decline
The reason I've just written all of that is not because I like Jerome Boateng. He played for Manchester City, and he's generally not a good bloke in his private life, so no, I don't like him. The reason I've just went on this tangent about Boateng is because he has changed as a player through the years, in a bad way. If I am mapping ratings to Lyon matches, it is not fair that I map Boateng's FIFA 17 rating, when he was fantastic for Bayern Munich, to a Ligue 1 match in 2023, in which he likely performed poorly for Lyon. He doesn't perform like a 90-rated player anymore (no where near actually), so I can't just greedily take the first rating I see and defile the fixture with inaccurate data.
It is the same in reverse. N'Golo Kante has been one of the best midfielders in the world the past 6 years, but in FIFA 15, he started off with a lowly 72 overall (compared to his peak rating of 90 in FIFA 22). So I decided to average the ratings through the years. Perhaps a smarter idea would've been to create a separate dictionary for each player and assign each season his rating for that respective FIFA game, but that feels a bit over-the-top and dull. Plus, there'd be issues with players not in certain editions of FIFA. For example, Diego Costa was in every single FIFA game from 15 to 21, but since he played in the Brazilian league (which is not in the game) for both the 2021-2022 season and part of the 2022-2023 season, he has not been in the past 2 games. Therefore, I just cracked on with the idea of averaging.
Video 4: Diego Costa's Finest Moment
After I mapped the ratings of players to both lineups and fixtures, things got much, much easier. Below is a dataframe of the 2018-19 Premier League season.
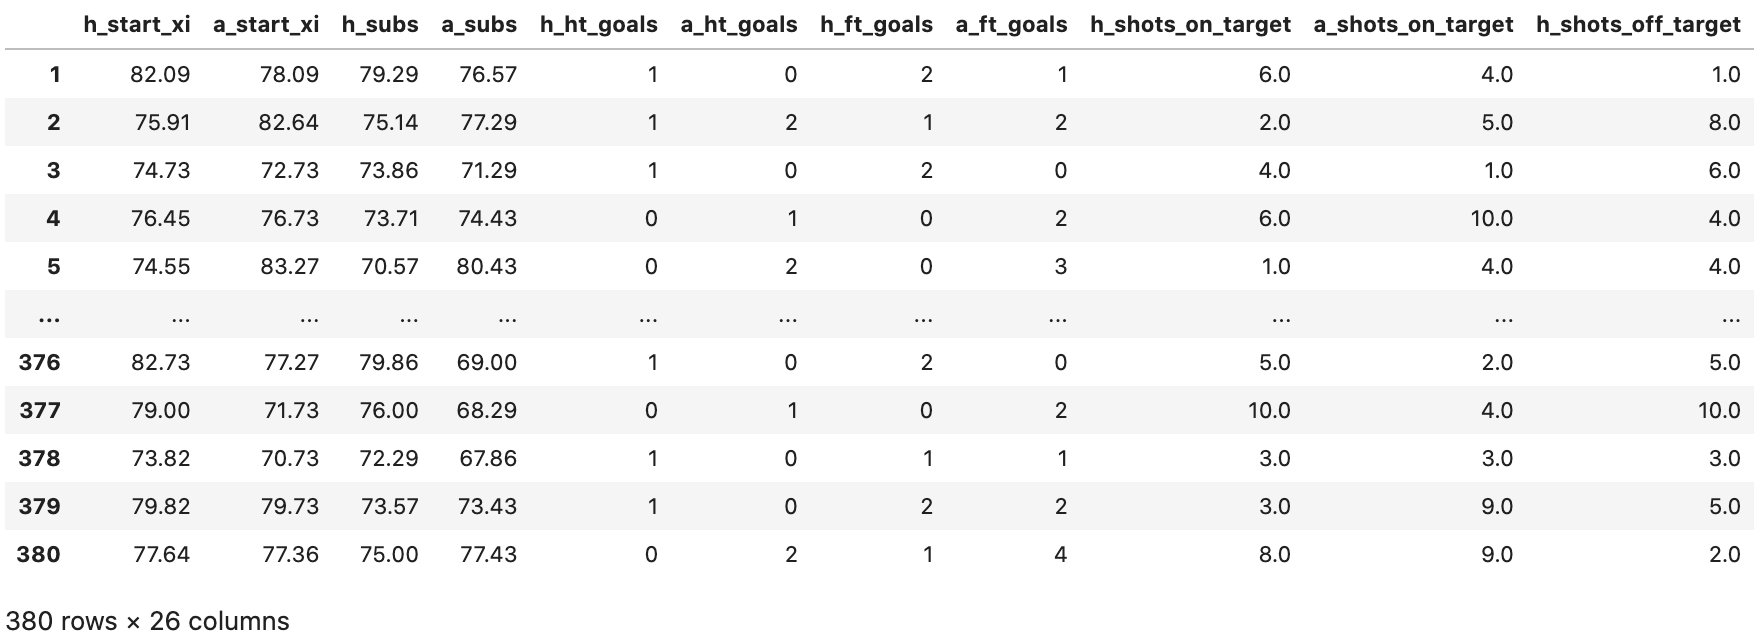
Figure 9: Example Pandas Dataframe
It was class. I did this for England, France, Germany, Italy, and Spain (and a couple other lesser known leagues), each for 5 separate seasons, and ended up with a dataframe of over 26k+ rows. I also extended the columns a bit, separating the ratings by position. See the table below for an example dataframe, consisting of fixtures in which the away team's quality was much, much higher than that of the home team's.
Figure 10: Lopsided Fixtures
As you can see, it's just pure domination. In the first row, the dominant team won by 9 goals. Wow. In the bottom, they won by 5. But in fixture_id 719455, it seems that the dominant team bottled it. They lost 2-1 with a 92-rated forward line. Quite a poor showing for them, but in the vast majority of the rows, the dominant team leathered the inferior team.
But, that one 2-1 loss haunted me; I couldn't sleep. How would I be able to replicate such shock results with only one model? From then on, I knew one wouldn't be enough. Football is random. 99 times out of 100, Manchester City demolish Burton Albion. But, on that 1 sole occasion, the stars align, and Burton Albion do enough to hold them to a 0-0 draw. That's just the way the sport is. Pretty much every other time though, it would end up like it did the last time these played one another.
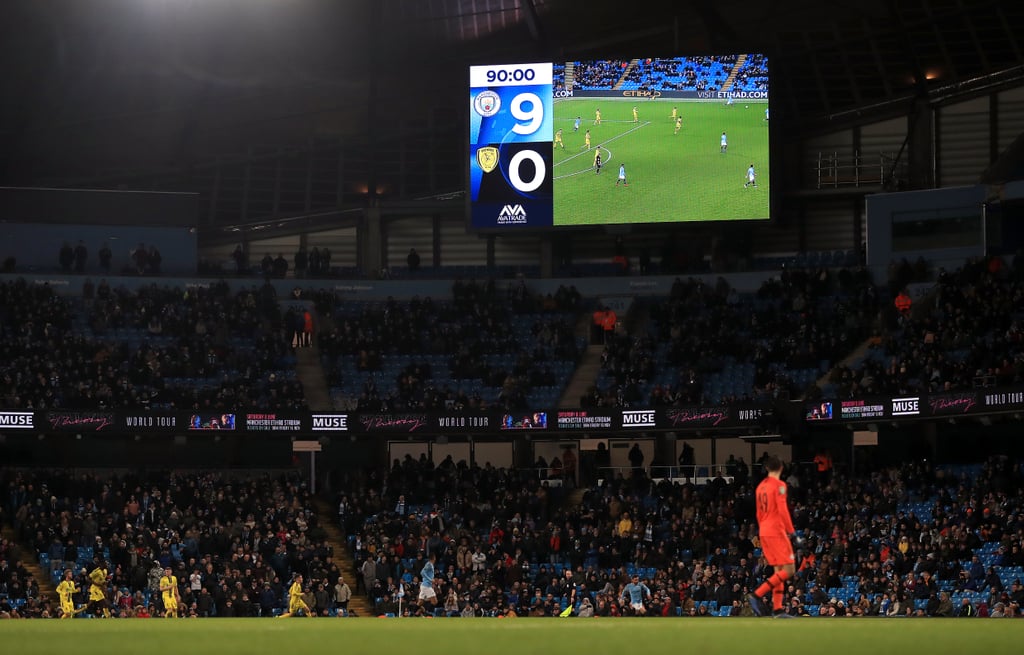
Figure 11: A Hiding
Based on the axiom above, multiple models were needed. And, having followed the sport for ages, I've sussed out the 4 categories that any given match, ever, can fall under:
- High goals scored, high accuracy (e.g. Barcelona 9 - 0 Blyth Spartans, Chelsea 4 - 1 Southampton, Woking 2 - 2 Solihul Moors, Juventus 3 - 0 Genoa, Inter 3 - 2 Milan).
- High goals scored, low accuracy (e.g. Chelsea 2 - 4 Southampton, MK Dons 1 - 3 Woking, Spezia 4 - 1 Juventus, Manchester City 0 - 2 Brentford, Barcelona 3 - 3 Ibiza, Real Madrid 1 - 3 Sevilla).
- Low goals scored, high accuracy (e.g. Barcelona 3 - 0 Blyth Spartans, Chelsea 1 - 0 Southampton, Juventus 2 - 0 SPAL, Everton 0 - 1 Manchester United, Manchester City 2 - 1 West Ham).
- Low goals scored, low accuracy (e.g. Chelsea 0 - 1 Southampton, Inter 0 - 1 SPAL, Manchester City 1 - 2 Everton, Manchester United 0 - 0 Woking).
In terms of frequency, scenarios 1 and 3 are perhaps the most common in world football, likely covering 70% of fixtures a week in any given league. Scenario 4 happens fairly often as well, but not as often as the other two. And scenario 2 is just peak. It's something that happens very infrequently, but when it does happen, the entire footballing world laughs. Examples of that would be Everton smashing City 4-0 a few years back, Chelsea getting bossed by Bradford City (as seen earlier), and Manchester United taking a 7-0 hiding off Liverpool a few months ago (😢).
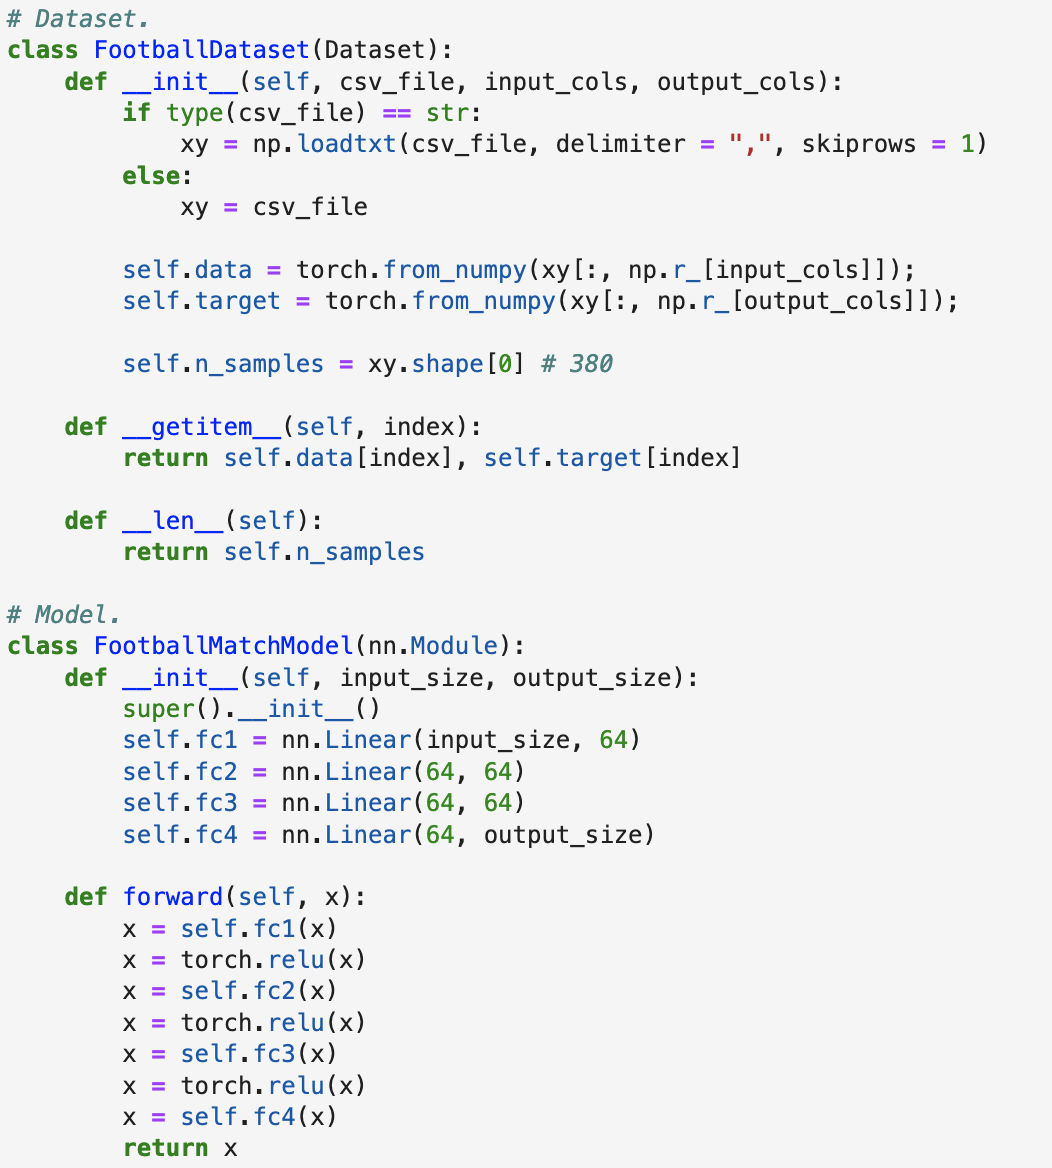
Figure 12: Snippet of PyTorch Code
Anyway, I created a feedforward neural network class, and a custom class to fit the big dataframe I generated. I filtered the big dataframe for each category of match in order to get my desired results, and I did. Then I saved them. Hooray! I ended up with 4.5 separate models. I say 4.5, because I accidentally generated another model that led to somewhat inaccurate results (e.g. Burnley 2 - 2 Manchester City), but results not completely out of the realm of possibility. Now, I was done with the scorelines. Thank goodness for that. Onto the match stats.
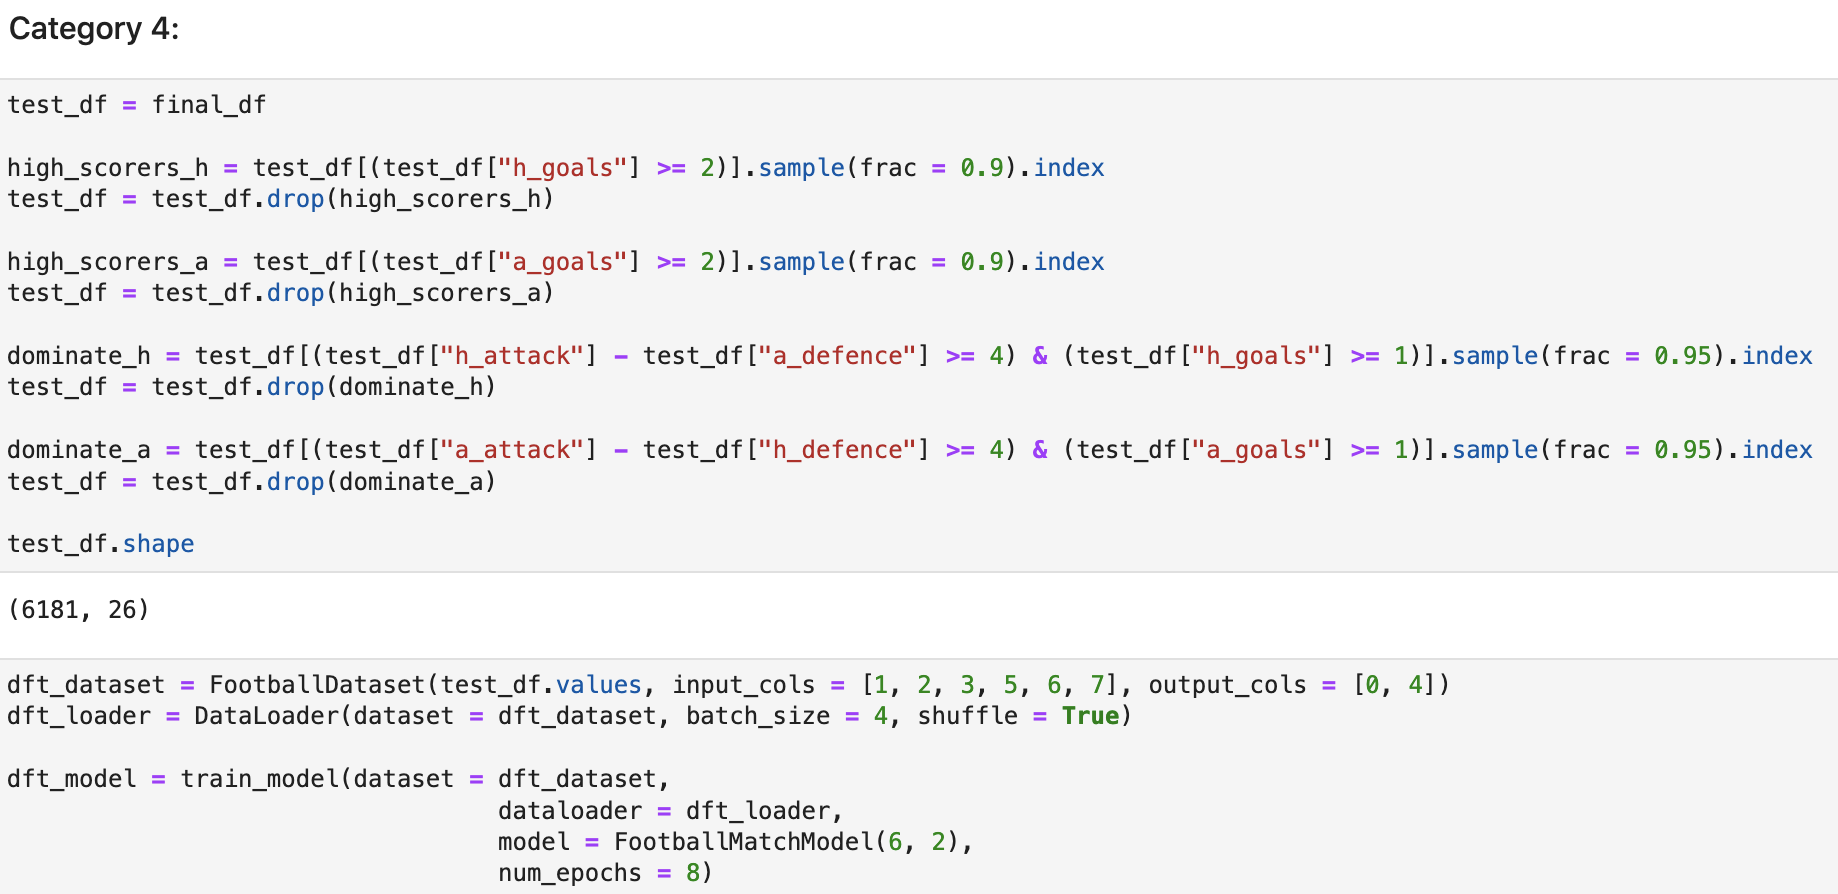
Figure 13: Category 4 Training
As for match stats.. possession was a really dodgy, inconsistent statistic, so I got rid of it completely. I only focused on shots on and off target. I created another set of models for the shots, but instead of using a dataframe of 26k rows, I used one of over 250k. I paid around 40 quid for CSVs of 10 different leagues across the last 10 years and ended up with a very, very comprehensive database of half-time goals, full-time goals, shots on and off target, possession, etc. I used that to create another set of models, but this time, for the shots:
- Low goals, low on target, low shots total (🥱).
- Low goals, high on target, high shots total (e.g. a bar fight).
- Low goals, low on target, high shots total (e.g. a poor quality match 🚮).
- High goals, high on target, low shots total (e.g. very clinical performances).
- High goals, high on target, high shots total (e.g. an all-out brawl).
Figure 14: Fixture Type 5
I was chuffed with my results. Unfortunately, based on the nature of deep learning, the model would return the same values for each number of goals, but I created a helper function in my API that varied the resulting values a bit. Finally, I finished all the training. Thank goodness. Time to introduce the interactive aspects of the game.
The player pool consists of players from FIFA 21 to FIFA 23. I limited it to these three games because I didn't want inaccurate ratings. Much like how Jerome Boateng had his ratings vary wildly through the 9 years, so did basically every other player. That is why I only limited it to a 3-year window. Also, I wanted it to be somewhat "with the times" as well. Here's what the interface looked like, which is what I modelled the selection page off of.
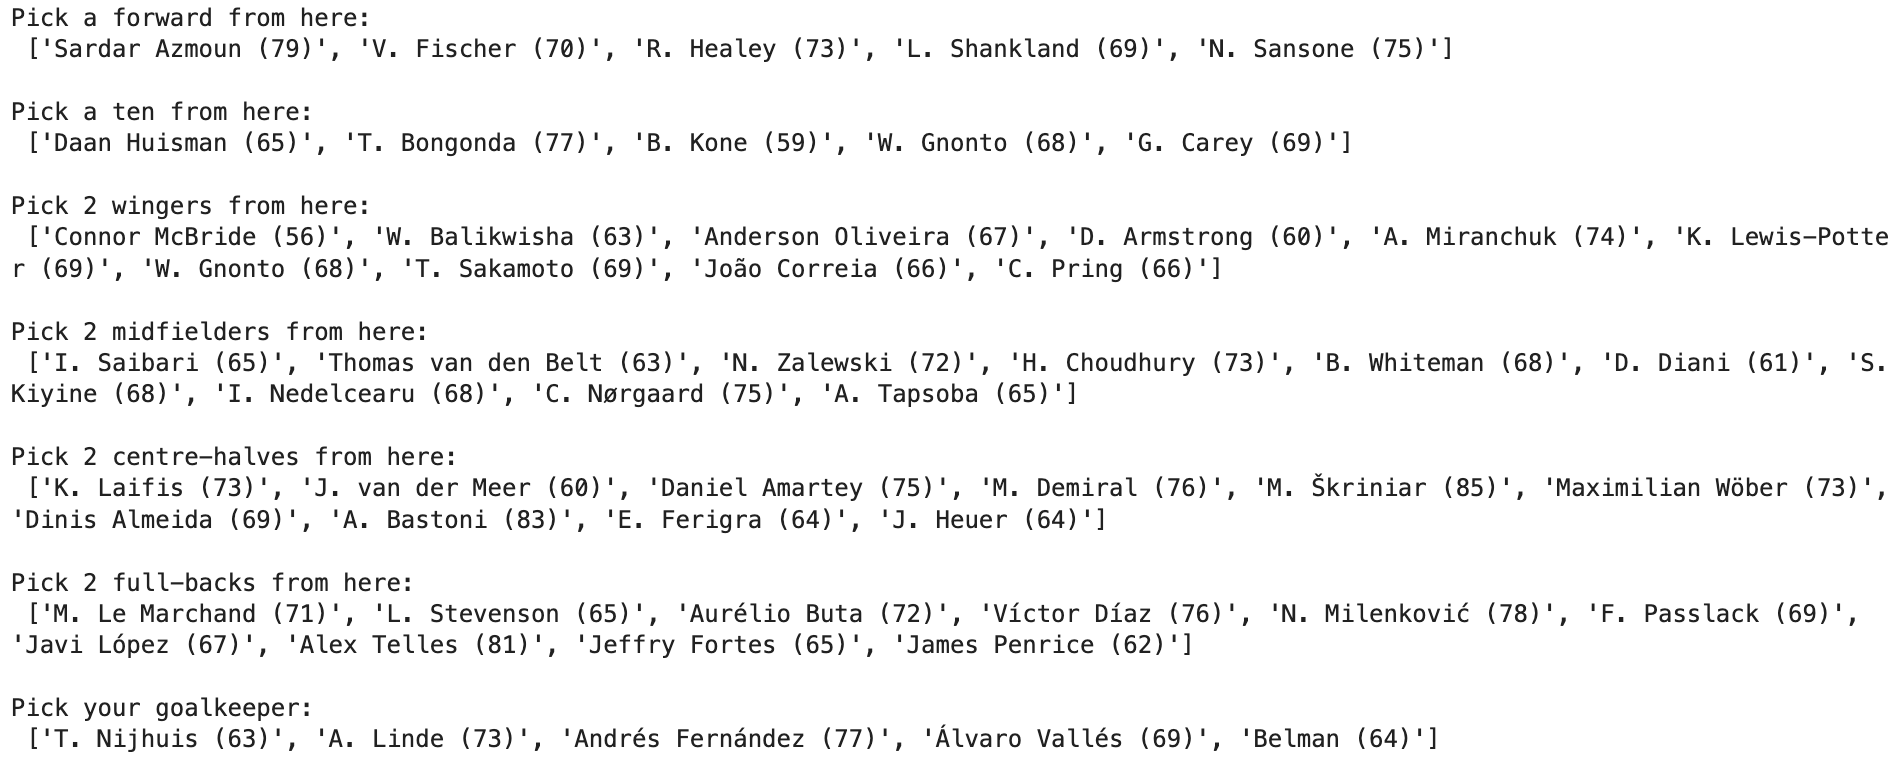
Figure 15: Interface of Selection Screen
That was pretty much it for the data gathering and cleaning. After, I began to create the React app and the Flask API. The React app.. I won't get into detail. Just look at the video(s) if you want to see what the frontend looked like. The Flask API was fairly simple. For each step on the website, I had a corresponding API call that supplied the functionality. For example, below is the endpoint I used to get the final score for the rounds.
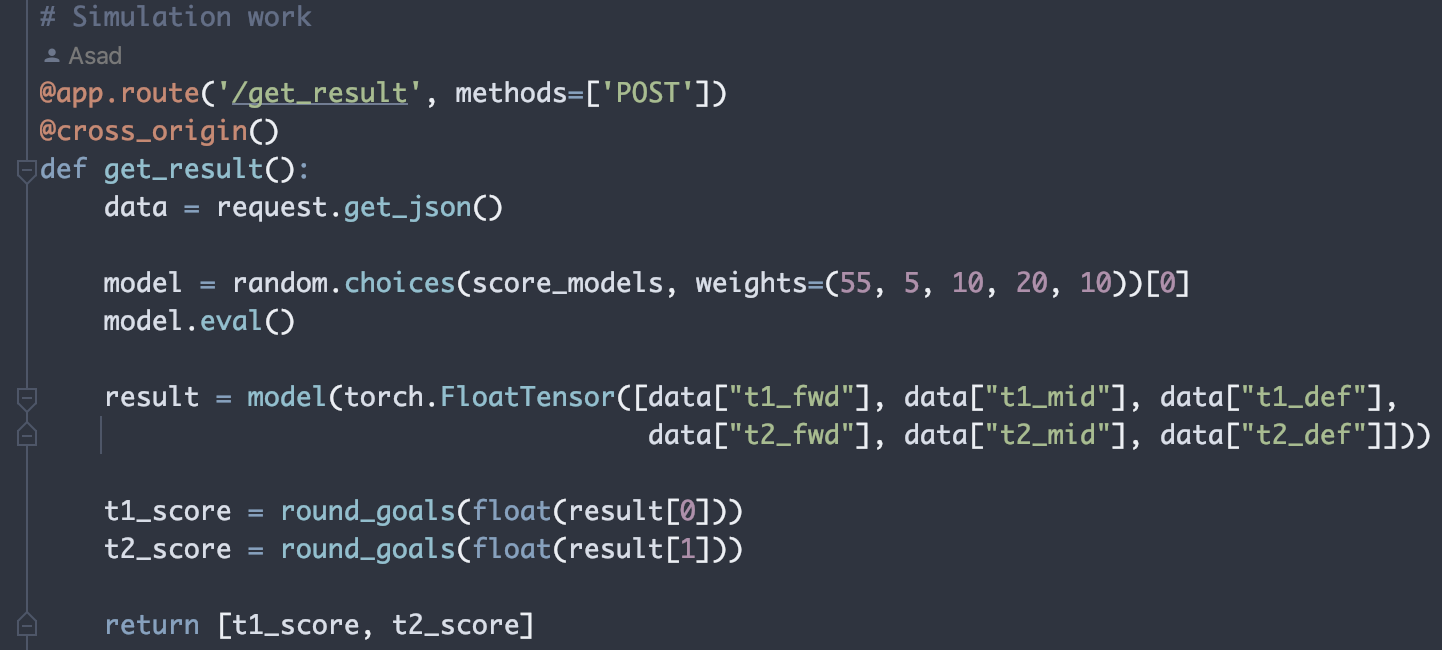
Figure 16: Result Endpoint
I had a similar function/endpoint for getting the total shots on and off target. Beyond that, the other highlights of the API were fetching the pool of players and generating the random teams. For each position, 7 random players are shown as options, and when the players are picked, they're removed from the pool permanently. This means the bots won't accidentally take one of the user's players, so you won't see a player on two different teams, thankfully.
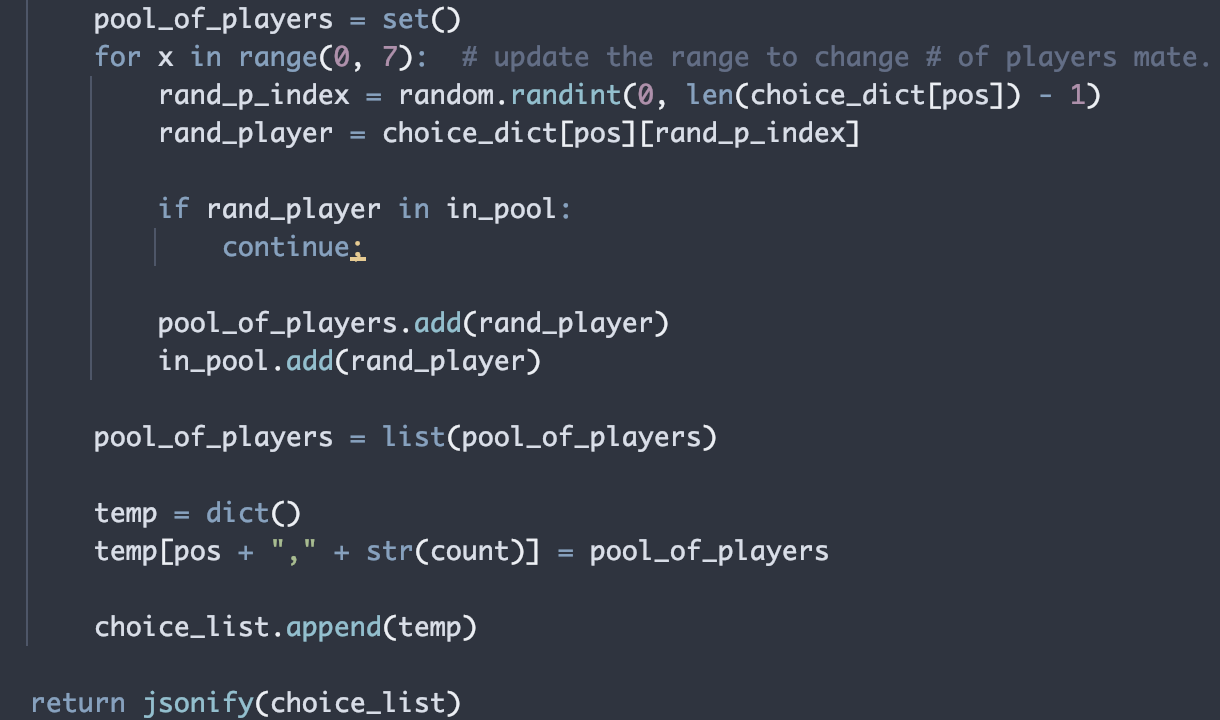
Figure 17: Pool of Players Code
Anyway, that's pretty much it for the functionality of the program. In my modest opinion, I think it was a very good project. I could've made it even better had I (amongst many other things):
- Sprinkled in some interesting match logic in the simulation pages (e.g. not just displaying goals and full-time whistle).
- Offered the ability to choose a manager and have that impact results as well.
- Shown player faces in the pool (tried doing it with 8-bit images using pyxlate, but my computer couldn't hack it).
- Deployed it using AWS as I did another project, so others could play the game too (costly £££).
Some other considerations too, like cleaning up the code a bit, but I'm just happy the project is complete. I also completed another football-related project I worked on at the same time too; I'll probably make another one of these for that. Anyway, thank you for your time. I believe I will improve upon this project sometime in the near future and put out an even better product (hence the "Version 1.0"). But that'll be for another day! ☀️